Now, more than ever, License Holders are using digital platforms to post services online, share their worship across social media sites (like Facebook and YouTube), and expand the reach of their organization. By adding one of our Podcast / Streaming Licenses to your account, ONE LICENSE makes it easy to share your services while staying copyright compliant.
We have seen an increase in the number of License Holders who are renewing their licenses with one of our Podcast / Streaming options, but many are not sure how to determine the correct category for their organization.
When looking at our licensing options, you will notice that our prices vary based on category ranges. Your category range is determined by your average weekly attendance. Your average weekly attendance is based on two factors. First, it’s important to monitor the number of viewers on your videos. Second, also count those congregants who attend in person. If remote congregants are worshipping via Zoom or Google Hangouts, for example, you would count those attendees in the same way you would count people who walk through the doors of your church. Your weekly attendance is the total of both video viewers and remote/in-person attendees. Once you determine your average weekly attendance, you would match that number to the applicable category range.
But how can you know how many viewers on YouTube and Facebook are your registered congregation members? When you post videos of your services on social media, you are opening your organization up to viewers who may not be members of your congregation.
A great way to collect information is to use YouTube and Facebook video analytics, which allows you to see the potential interactions your ministry is having in the digital community. While the number of views does not always accurately depict attendance, you can interpret the numbers and get a good estimate of how many online viewers are members of your congregation.
Because the internet can often bring unpredictability with the number of people your video will reach, the ONE LICENSE Podcast / Streaming License allows for 3x your average weekly attendance in views to account for those outlier views. Going back to the category range assessment from earlier as an example, you would choose Category D if you have under 400 consistent individuals for your average weekly attendance, but you are given a large buffer of up to 1,200 for unpredictable online viewers. Social media sites count a view as anyone online who clicks to watch the video, even if they are only watching for a few seconds. In fact, Facebook counts anything longer than 3 seconds as a full view! We understand that social media sites can be unpredictable, and this is why we give you a buffer.
If you are posting your service videos online, you will need to turn to video analytics to help you determine your average weekly attendance. Be sure you go to the site where your video is hosted for the most accurate information.
YouTube Analytics
YouTube counts views in two ways:
- A user intentionally initiates the watching of a video (by clicking on the link).
- A user watches the video on the platform for at least 30 seconds.
To learn more about your viewers on YouTube, follow these steps:
- Go to your channel and click on any of your videos.
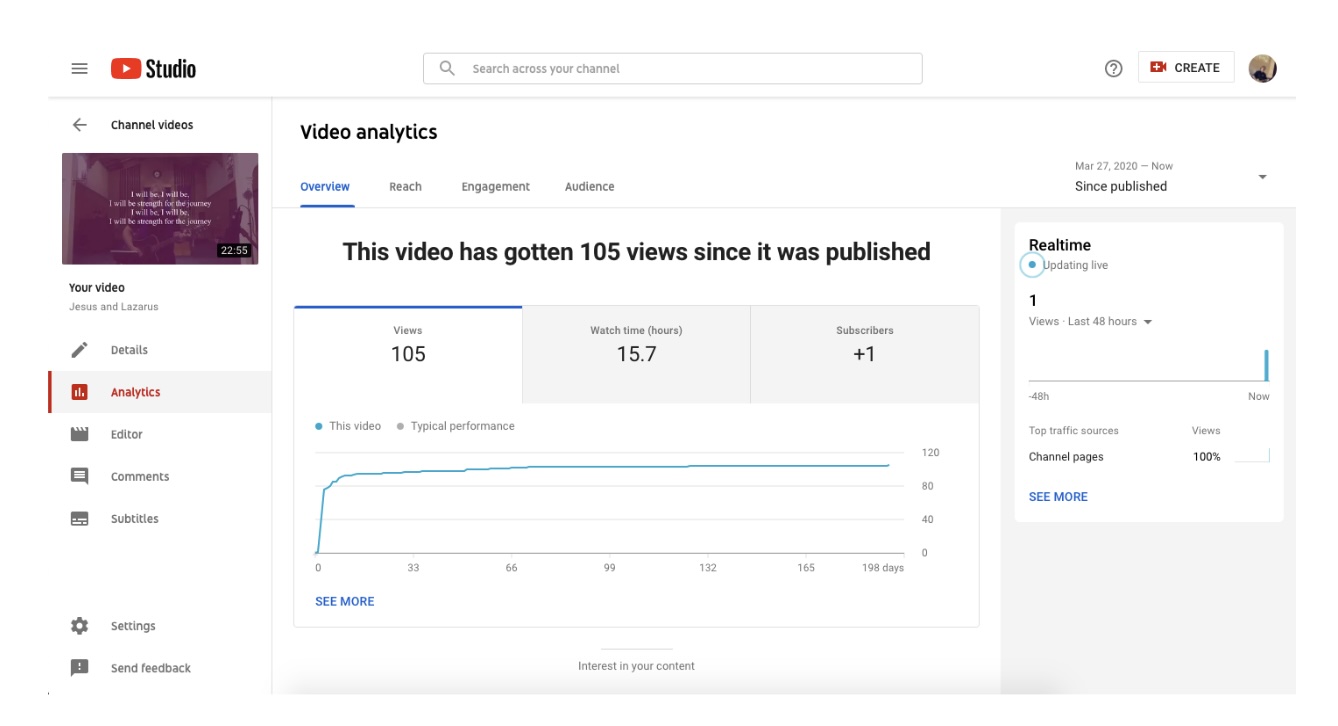
- Under the video, select the Analytics button. You will be taken to your Studio.YouTube.com page.
- There, you will find all the information you could ever want to know about who is viewing your videos, how they are finding the video, how many hours the video has been played, and so much more. The trick is finding the best way to interpret the data you have been provided.
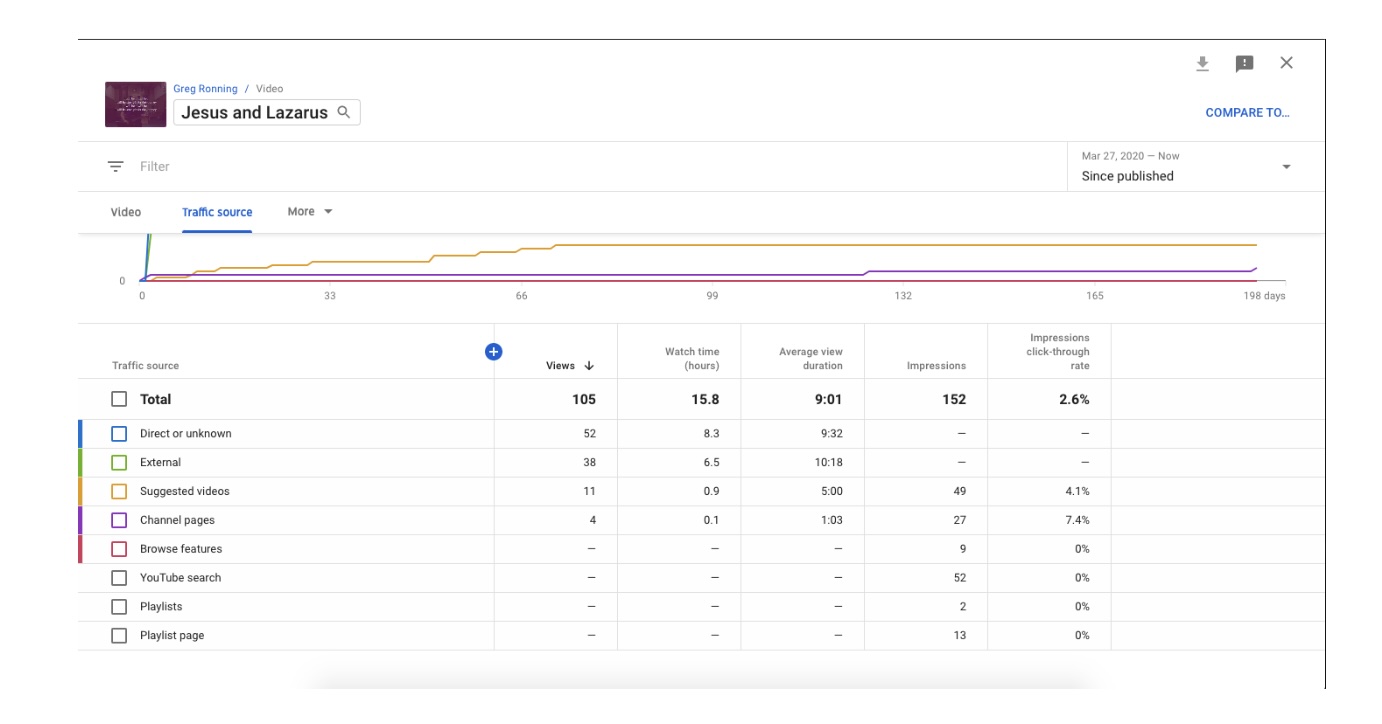
- One way to do this is to click on “See More” under the Views Graph in your Overview tab. A new window will pop up with an overview of your video’s views. Next to “Video,” click on “Traffic Source.”
- Below the new graph is a breakdown of the source (i.e., how people are finding your video). Following the source, you’ll see “Number of Views by Source” and the average amount of time viewers from that source watched your video.
- For the purpose of calculating your average weekly attendance, we suggest counting the groups that watched at least the length of the sermon (or longer) as attendees. It is common to see views in length anywhere from 7 minutes (or the length of your sermon) to the full length of the video.
- To find an average, we suggest looking at the past 4-8 weeks of videos, or more if they are available. Add this average to your in-person attendance number to determine your true average weekly attendance.
Facebook Analytics
As mentioned above, Facebook counts a user who watches a video for 3 seconds as a view. To understand Facebook video analytics, follow these steps:
- Go to the Page you are administering or editing.
- Under the “Manage Page” sidebar, select “Insights.” Here, you can analyze the engagement and reach on all of your organization’s posts.
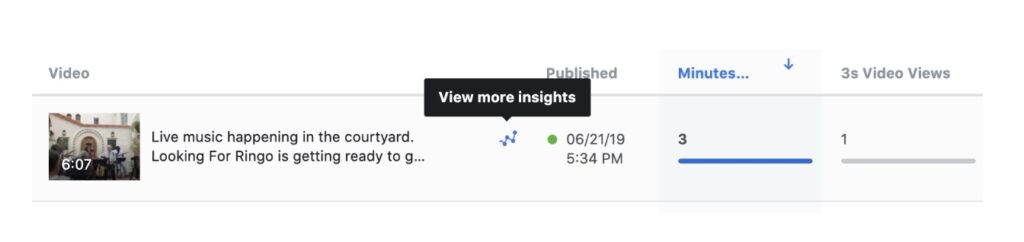
- To look specifically at your streamed services, scroll down in the left sidebar, click on “Videos,” and select a video you have posted in the last week, month, or quarter. To look at the numbers for a specific video, hover over the video and click the blue plot graph image that pops up between the video description and the published date. It should say “View more insights” when you hover over the graphic.
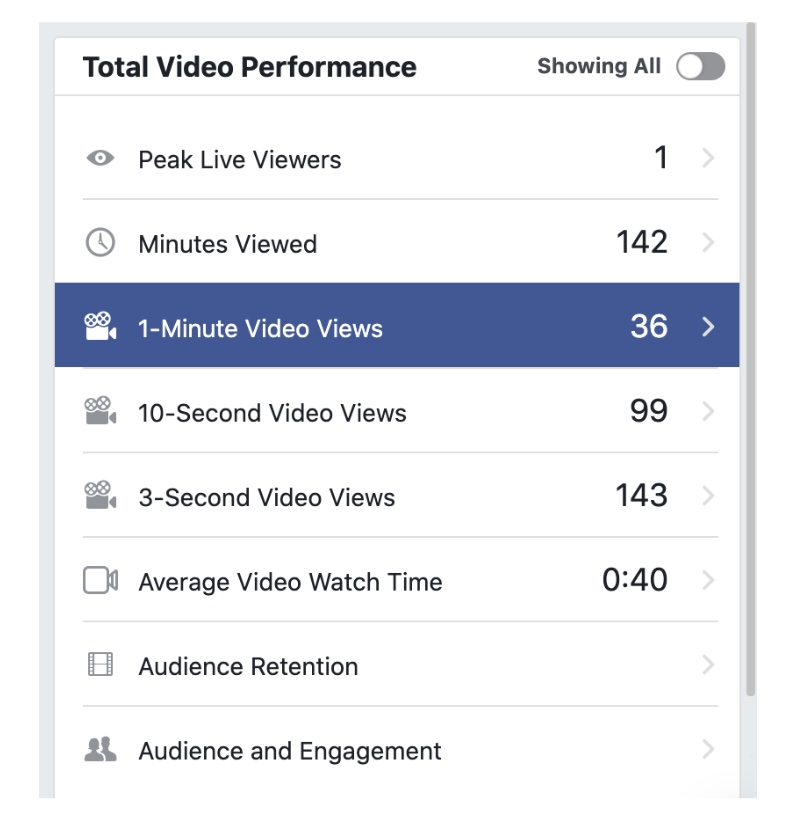
- Look at the number next to “1-Minute Video Views.” This will be the closest to determining who watched the video for an extended period of time. We ask that you use this number as your online attendance number.
- Once you’ve figured out your attendance for one video, repeat the process for all the videos you post each week. Add together all the video views and divide by the number of videos to determine your average weekly online attendance.
If you are having in-person and online worship, be sure to add your average online attendance number to your in-person attendance number to calculate your true average weekly attendance.
Keep in mind that Facebook and YouTube analytics are helpful indicators, but the numbers are not perfect. That’s a big reason why our categories are defined as “ranges.” Not only do you have plenty of room for typical shifts in attendance (e.g., snow birds, college students, holidays, etc.), but you also have room for variances in your online viewership. Our hope is that these analytics give you a better picture of what your online attendance and engagement looks like.
An Alternative to Online Analytics
If accessing online analytic information seems too cumbersome, there is an alternative you might consider. Send out a survey to your congregation asking members to indicate which services they attended online and how many people in their household were watching (be sure to indicate that the survey is for online viewers only). These surveys can be created through Google Forms, Survey Monkey, and other online survey platforms.
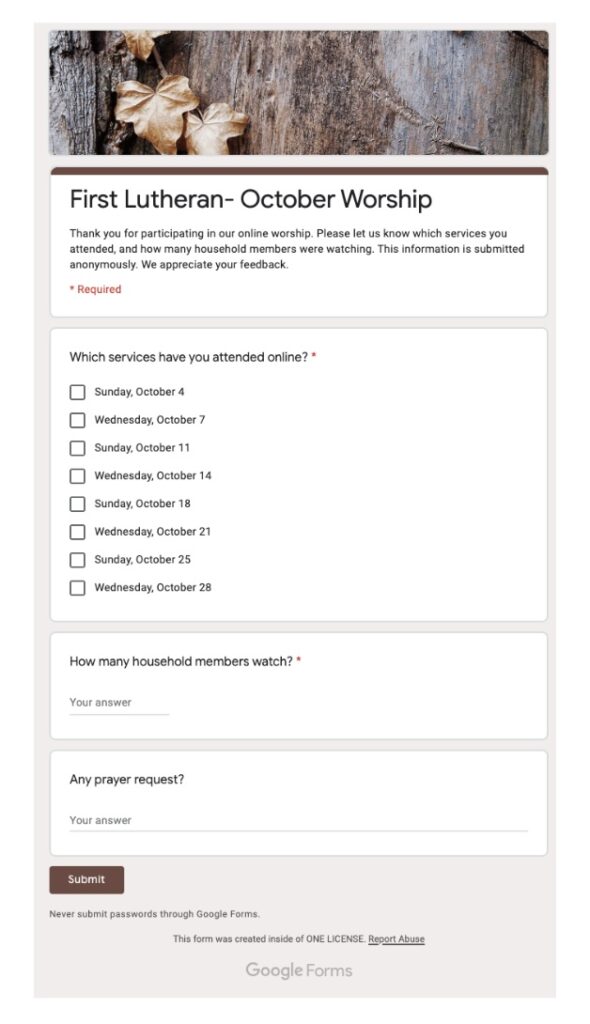
Once the surveys are completed, you can use the information to determine your new average weekly attendance. While it is not a perfect solution, especially since there is no guarantee in survey responses, it will hopefully provide you with an estimated number of online viewers. Be sure to add that number to your in-person attendance numbers to determine your average weekly attendance, and reference our category breakdowns here: https://www.onelicense.net/options-and-prices
At ONE LICENSE, we realize this is new territory for many of our License Holders. Please email our team at info@onelicense.net if you have any questions or need to adjust your category range. We are happy to help.
Featured image photo copyright information: Freestocks.org. This image is available for download at www.pexels.com.
Example Screenshots used with permission from Pr. Greg Ronning (The Table OC / First Lutheran Church Fullerton).